- 02Mar2015
-
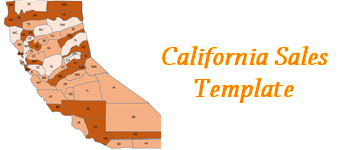
California Sales Template with Heat Map in Excel
Does your company have sales spread all over the counties in a State like California? Are you bored of having your sales data represented using regular in-built excel charts? Are you looking for a more intuitive way to represent your data?
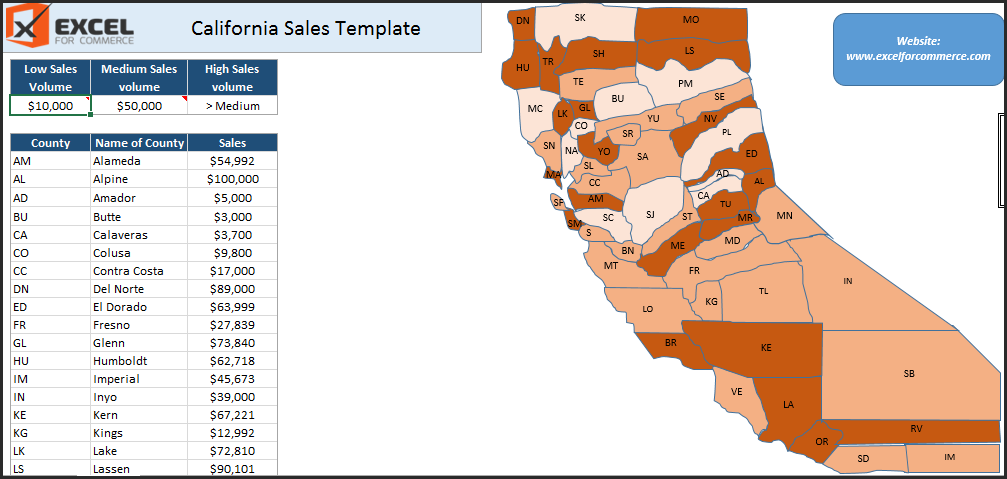
Then this California Sales Template is for you. This template will help you in visualizing your sales by county, in the form of a Heat Map in Excel. We have included a heat map that uses variation in color density to represent sales data. This visual will help us to understand which county is doing well and which county is not. Let’s have a look at the template. The free download link is available at the end of this blog.
The above image is a sample showing sales using Heat Map.
In the first table, enter the cut-off values to define your low and medium sales range. For example, if we enter $10,000 for ‘Low sales Volume’ , $50,000 for ‘Medium Sales Volume’, then all the sales from $0 to $10,000 will be treated as low sales numbers, $10,001 to $50,000 will be treated as medium sales numbers. Any number greater than or equal to ‘Medium Sales Number’ ($50,000 in our example) will be treated as ‘High Sales Volume’.
The ‘second table’ consists of county names against which you can add your sales numbers/volume. After entering the data in both the tables, the heat map automatically shows the counties with respective color intensity. Light Orange has been used to represent Low Sales Volume, Medium orange is used for Medium Sales Volume and Darker shade of Orange has been used to show High Sales Volume.
This Sales template is based on all counties in California. You can contact us here if you have any queries with respect to this template. If you are looking for any customized templates or maps, you can always contact us. We will be happy to help you. You can download the free template here : California Sales Template.xlsm
Note: You need macros enabled to use this template. Works in all versions from 2007 and above.
- 2 Mar, 2015
- Excel for Commerce
- 1 Comments
- california sales template, Excel Consultant, Excel Expert, heat map in excel, sales template,
Comments
-

-
NavinMishra
- Jun 17 2022
-
Heat map for educational purpose